Crystal balls at the ready, because it’s time to do some forecasting! You’ve been there, your boss or client asks you to try to make a forecast or plan for some time in the future. It could be the coming year, quarter or month. Regardless, all you’ve got is a bunch of past data, some of it detailed, some of it partial, and almost all of it comes from different places. So you’ve probably got to buckle in for a lot of Excel work to forecast it, right?
That’s certainly one option, and it’s probably the first method that comes to mind for most people. Forecasting anything is a huge challenge, there’s no easy way of doing it. With forecasting, it’s almost easier to accept that whatever you come up is going to be wrong anyway. But that’s no reason to put a finger in the air and see which way the wind is blowing.
This is where Instant Forecaster can come in to help. This tool helps to give you a head start with forecasting, with a bit of a boost from machine learning. You use your data to train the model, and by entering in some details to help tell it about some seasonality traits and the cadence of your data, you’ll soon be given a forecast for a number of steps of your choice.
Time series forecasting in machine learning is a difficult task. In fact, it’s a difficult task even without machine learning. You’ve got to take into account historical data, outliers, bad data and changes in the patterns. How on earth is your Excel sheet going to get it done so you can get back to doing more important things? Let’s see how you can start using Instant Forecaster instead.
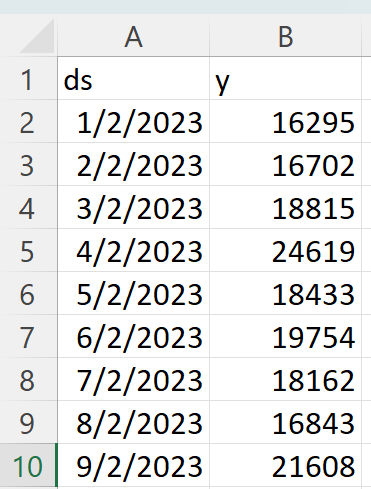
It’s unavoidable, but you do need to prepare a little bit of Excel work (sorry). Luckily, you only need 2 columns: “ds” and “y”. “ds” is your date stamp, it’s basically the date for each row of data. “y” is the column for the corresponding data value for each date. Make sure your date stamps are consistent – so if they’re weekly, make sure you have data for each week in your series. Below is a screenshot of an Excel file to show you how it should look like. Save it as a “CSV” file.
Once you have your data ready, upload it and then input details about the data. You need to say if your data is daily, weekly or monthly, and you also need to say if your data is susceptible to any seasonality factors. Once you’ve done all of this, the last thing you need to do is to tell it how many units of forecasting you want – do you need 4 more rows, or 20? When you’re ready, just hit submit and you’ll get your results.
And that’s Instant Forecaster! You’ll even get a nice graph to visualise your forecast. All that’s left now is to try it out, and see how much time you can save after training your machine learning model.